Profiling Go: Basics and Practice
April 23, 2020 Profiling Pprof Benchmark Ab Cpu Allocation Remote

Go has rich profiling tools from the very beginning — the pprof package and go tool pprof. Let’s discuss why profiling is useful, how to work with it, and what’s new in this area.
Why Profiling is Useful
While using a debugger, one can find logic mistakes. This is basic debugging.
A program could work logically correctly, but the following side effects could appear:
- long execution time in some cases;
- high memory consumption;
- high processor load;
All of the above are not bugs as long as the program is still functioning. However, high resource consumption is expensive for service owners — supporting such services requires new hardware resources from time to time.
If the service’s external load is increasing, all these “weak points” could become the reason for unexpected failures — if the service runs out of memory, it will just exit; if there is not enough CPU, the server will become unavailable even for SSH connections.
A profiler is extremely helpful for inspecting the program to find such issues.
What Tool is Good for Profiling
Go’s standard profiler tool — pprof — is excellent. Let’s use pprof.
How to Profile
Profiling consists of two activities:
- collecting profiling data from the service;
- visualizing and analyzing the data;
In order to collect profiling data, one should:
- implement manual metrics collection and exporting with the
pprofpackage, or - start the
net/http/pprofendpoint, which provides profiling data exporting;
For beginners, it’s simpler to use option 2.
To start the profiling endpoint, one should:
- add
import _ "net/http/pprof"to the program code; - if there is already a
net/httpserver started in the program — nothing more is required; - if not, one should add server start code:
go func() {
    log.Println(http.ListenAndServe("localhost:6060", nil))
}()
According to the net/http/pprof source, it becomes obvious what that import does:
func init() {
    http.HandleFunc("/debug/pprof/", Index)
    http.HandleFunc("/debug/pprof/cmdline", Cmdline)
    http.HandleFunc("/debug/pprof/profile", Profile)
    http.HandleFunc("/debug/pprof/symbol", Symbol)
    http.HandleFunc("/debug/pprof/trace", Trace)
}
Profiling Example
I’m going to profile a web service started at localhost:8090.
I’ve imported net/http/pprof and added an HTTP server start.
Getting Profile Data
First, I’m going to load my service using the Apache Benchmark (ab) tool:
ab -n 1000 -c10 http://localhost:8090/
ab prints its own statistics about request times, but currently I don’t need it. I’m going to analyze profiling data for now.
While the service is under load, I request CPU profiling data for the following 5 seconds:
curl http://localhost:6060/debug/pprof/profile?seconds=5 > ./profile
As a result, the profile file is downloaded. That’s all for getting profiling data. Let’s analyze it.
CPU Profile Analysis
Let’s open the profiling data I’ve just downloaded with go tool pprof:
go tool pprof ./profile
Type: cpu
Time: Apr 19, 2020 at 9:28pm (+03)
Duration: 5.40s, Total samples = 400ms ( 7.41%)
Entering interactive mode (type "help" for commands, "o" for options)
We can print data as an image:
(pprof) web
This requires Graphviz tool installation.
As a result, I got a function scheme where the longest-running functions are bigger than others.
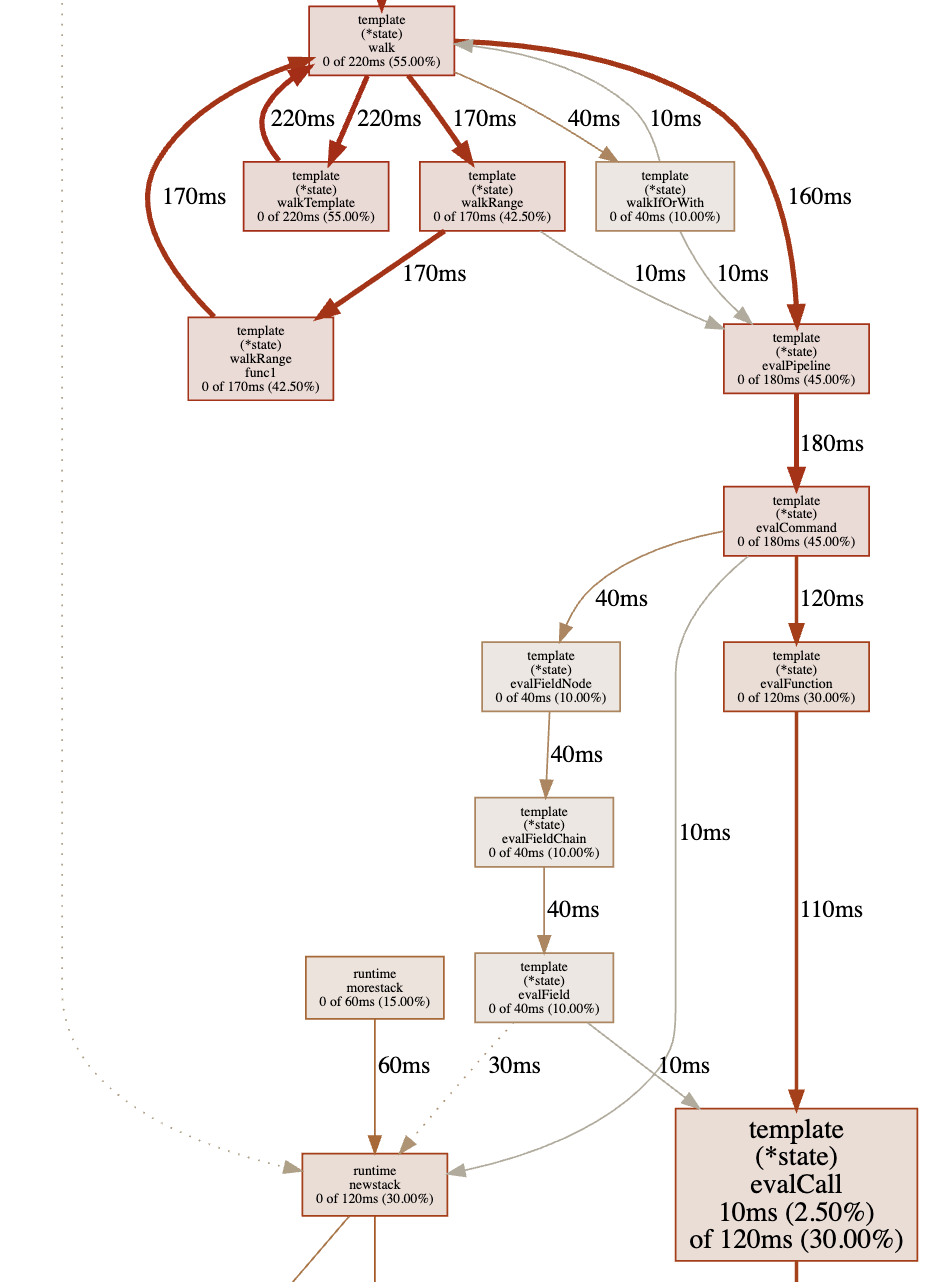
As we can see, the most time is spent on html/template package calls, which involves Go sources. This is the profiler’s standard behavior — it doesn’t matter if the function is from application code or from Go sources.
Let’s get back to the pprof terminal and print the top 15 functions by work time:
(pprof) top15
Showing nodes accounting for 0, 0% of 400ms total
Showing top 15 nodes out of 147
      flat  flat%   sum%        cum   cum%
         0     0%     0%      260ms 65.00%  net/http.(*conn).serve
         0     0%     0%      240ms 60.00%  github.com/labstack/echo.(*Echo).ServeHTTP
         0     0%     0%      240ms 60.00%  github.com/labstack/echo.(*Echo).ServeHTTP.func1
         0     0%     0%      240ms 60.00%  github.com/labstack/echo.(*Echo).add.func1
         0     0%     0%      240ms 60.00%  github.com/labstack/echo.(*context).Render
         0     0%     0%      240ms 60.00%  github.com/labstack/echo/middleware.AddTrailingSlashWithConfig.func1.1
         0     0%     0%      240ms 60.00%  github.com/labstack/echo/middleware.CORSWithConfig.func1.1
         0     0%     0%      240ms 60.00%  net/http.serverHandler.ServeHTTP
         0     0%     0%      220ms 55.00%  html/template.(*Template).Execute
         0     0%     0%      220ms 55.00%  text/template.(*Template).Execute
         0     0%     0%      220ms 55.00%  text/template.(*Template).execute
         0     0%     0%      220ms 55.00%  text/template.(*state).walk
         0     0%     0%      220ms 55.00%  text/template.(*state).walkTemplate
There is also template rendering in the top.
We can print any function source to see which part of it is taking which time:
(pprof) list text/template.\(\*state\).walk$
Total: 400ms
ROUTINE ======================== text/template.(*state).walk in /usr/local/Cellar/go/1.14/libexec/src/text/template/exec.go
         0      830ms (flat, cum) 207.50% of Total
         .          .    250:	s.at(node)
         .          .    251:	switch node := node.(type) {
         .          .    252:	case *parse.ActionNode:
         .          .    253:		// Do not pop variables so they persist until next end.
         .          .    254:		// Also, if the action declares variables, don't print the result.
    160ms    160ms    255:		val := s.evalPipeline(dot, node.Pipe)
         .          .    256:		if len(node.Pipe.Decl) == 0 {
     20ms     20ms    257:			s.printValue(node, val)
         .          .    258:		}
         .          .    259:	case *parse.IfNode:
     40ms     40ms    260:		s.walkIfOrWith(parse.NodeIf, dot, node.Pipe, node.List, node.ElseList)
         .          .    261:	case *parse.ListNode:
         .          .    262:		for _, node := range node.Nodes {
    220ms    220ms    263:			s.walk(dot, node)
         .          .    264:		}
         .          .    265:	case *parse.RangeNode:
    170ms    170ms    266:		s.walkRange(dot, node)
         .          .    267:	case *parse.TemplateNode:
    220ms    220ms    268:		s.walkTemplate(dot, node)
         .          .    269:	case *parse.TextNode:
         .          .    270:		if _, err := s.wr.Write(node.Text); err != nil {
         .          .    271:			s.writeError(err)
         .          .    272:		}
         .          .    273:	case *parse.WithNode:
Conclusion:
- there is recursion here (line 263);
- there are
reflectpackage calls, which are considered “heavy”; - I can’t change Go source code.
But I can change my service code that calls Go standard packages. Currently, there is a template call on every client request in my service. However, the templates are static and constant. The output of the template call depends on request data.
I’m going to cache the template call result — rendering will be called once for each request data combination. On the first request, there is no data in the cache. In that case, the template call is executed. The result of the template call is saved into the cache with a key generated from request data. On every request, the service checks if there is data in the cache by a certain key. And the service uses cached data if there is any.
I changed the service code and ran profiling again. The results are below:
(pprof) top15
Showing nodes accounting for 90ms, 50.00% of 180ms total
Showing top 15 nodes out of 78
      flat  flat%   sum%        cum   cum%
         0     0%     0%      100ms 55.56%  net/http.(*conn).serve
     90ms 50.00% 50.00%       90ms 50.00%  syscall.syscall
         0     0% 50.00%       60ms 33.33%  bufio.(*Writer).Flush
         0     0% 50.00%       60ms 33.33%  internal/poll.(*FD).Write
         0     0% 50.00%       60ms 33.33%  net.(*conn).Write
         0     0% 50.00%       60ms 33.33%  net.(*netFD).Write
         0     0% 50.00%       60ms 33.33%  net/http.(*response).finishRequest
         0     0% 50.00%       60ms 33.33%  net/http.checkConnErrorWriter.Write
         0     0% 50.00%       60ms 33.33%  syscall.Write
         0     0% 50.00%       60ms 33.33%  syscall.write
         0     0% 50.00%       40ms 22.22%  runtime.findrunnable
         0     0% 50.00%       40ms 22.22%  runtime.mcall
         0     0% 50.00%       40ms 22.22%  runtime.schedule
         0     0% 50.00%       30ms 16.67%  github.com/labstack/echo.(*Echo).Start
As we can see, there are syscall.Write calls in the top now. And template calls are not in the top anymore.
This is perfect! Because the goal of our changes is to make application behavior as fast as possible, to make basic OS operations — reading and sending data over the network — appear at the top.
Now let’s compare the ab results — the “Requests per second” row:
- Before: Requests per second: 14.13 [#/sec] (mean)
- After: Requests per second: 638.38 [#/sec] (mean)
As we can see, the service is performing much faster now.
Conclusion
One can open the net/http/pprof endpoint in a browser. It is the same endpoint we used curl to get profiling data. The page looks as follows:
/debug/pprof/
Types of profiles available:
| Count | Profile |
|---|---|
| 9 | allocs |
| 0 | block |
| 0 | cmdline |
| 9 | goroutine |
| 9 | heap |
| 0 | mutex |
| 0 | profile |
| 18 | threadcreate |
| 0 | trace |
We can grab some other metrics:
- about memory allocation in every function;
- about
sync.Mutexcalls; - about new thread creation;
- and many others.
The most useful here are CPU and memory profiling.
Remote Profiling
The profiling pprof endpoint, which we’ve enabled above, can be accessed from an external network:
// server listens on every network interface (not only localhost), port 6060
log.Println(http.ListenAndServe(":6060", nil))
But one should be careful to restrict it for developers only!
It is very useful to profile production services, but the profiling endpoint available for external client requests is a vulnerability — profiler calls slow down the service.
What’s New in the Profiling Topic
The profiling data providing approach covers any situation and is not going to be changed.
However, data analysis can be improved here. A lot of visualization tools have been released.
To me, the most helpful is flamegraph.
There are Go profiling data display possibilities in GoLand IDE. But go tool pprof also provides rich filtering and sorting functionality. There is no such functionality covered in this article, but there are some examples in the Go blog.
Related Articles
Principles of slice type in GO

The Go blog describes how to use slices. Let’s take a look at slice internals.
Read More → Slice Allocation Sources