Why and how to use a debugger with Go
March 24, 2020 Debugger Goland
A debugger is a very helpful and powerful tool. It can help you understand exactly what is happening in your code, explore new projects, and avoid unnecessary debug code changes.
The time we need to fix any issue depends on the stage where it is found:
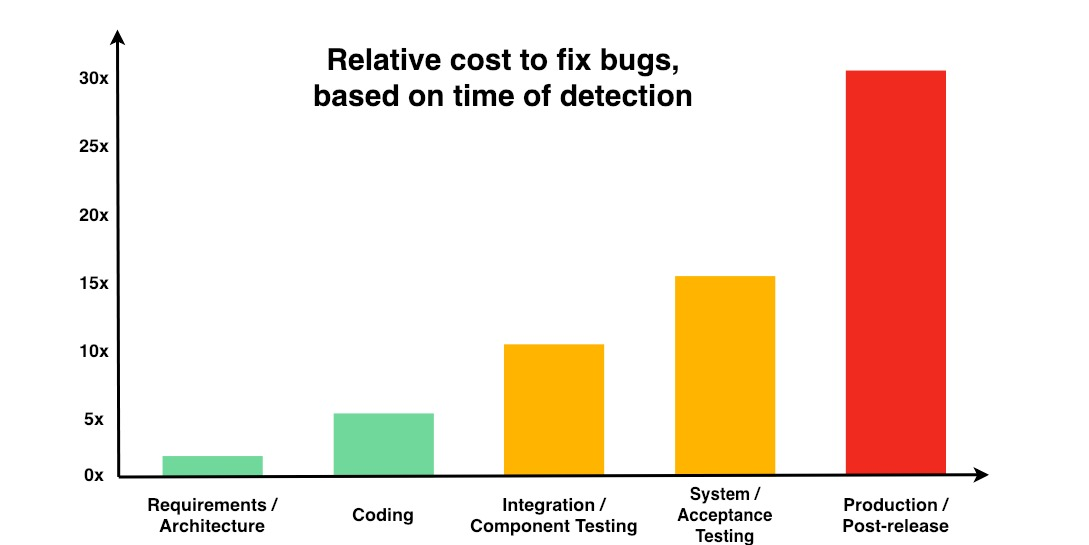
The best way to fix any issue is to fix it before any code is written (during the planning stage). But if we already have a bug in the code, it’s better to deal with it during the development stage.
So, the earlier we fix bugs, the more efficient we are as developers and as a team.
A debugger is extremely helpful here. It is a very common tool in many programming languages, but it seems to me that Go developers are not using it. I will describe why it is helpful and why I recommend using it with examples in GoLand IDE.
What is a debugger?
A debugger is all about breakpoints. You set up points where you want your program to stop, so you will be able to monitor the program’s state.
First, you set up a breakpoint:
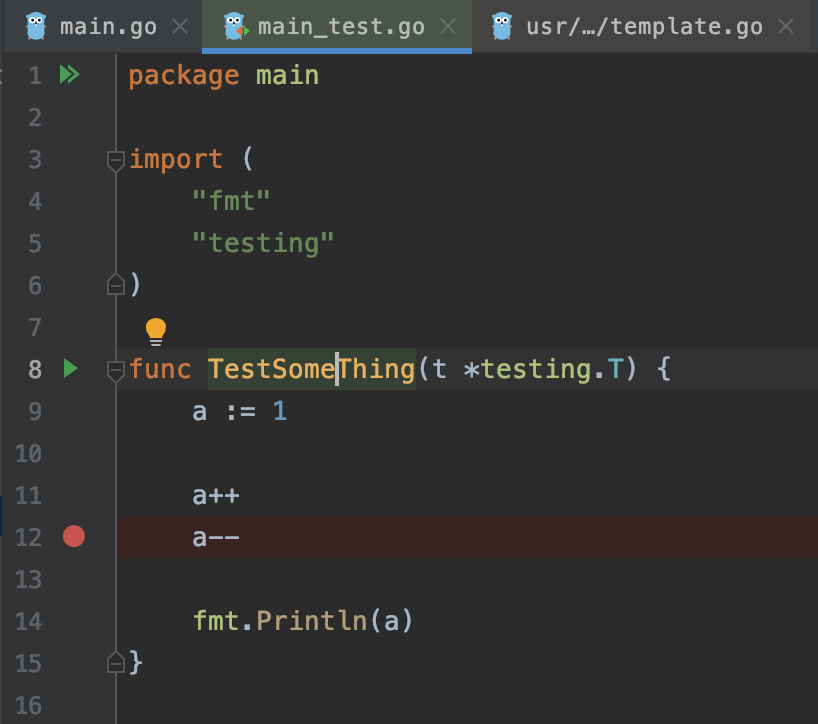
The program will stop before the line you selected.
Next, you run your program or test and it stops:
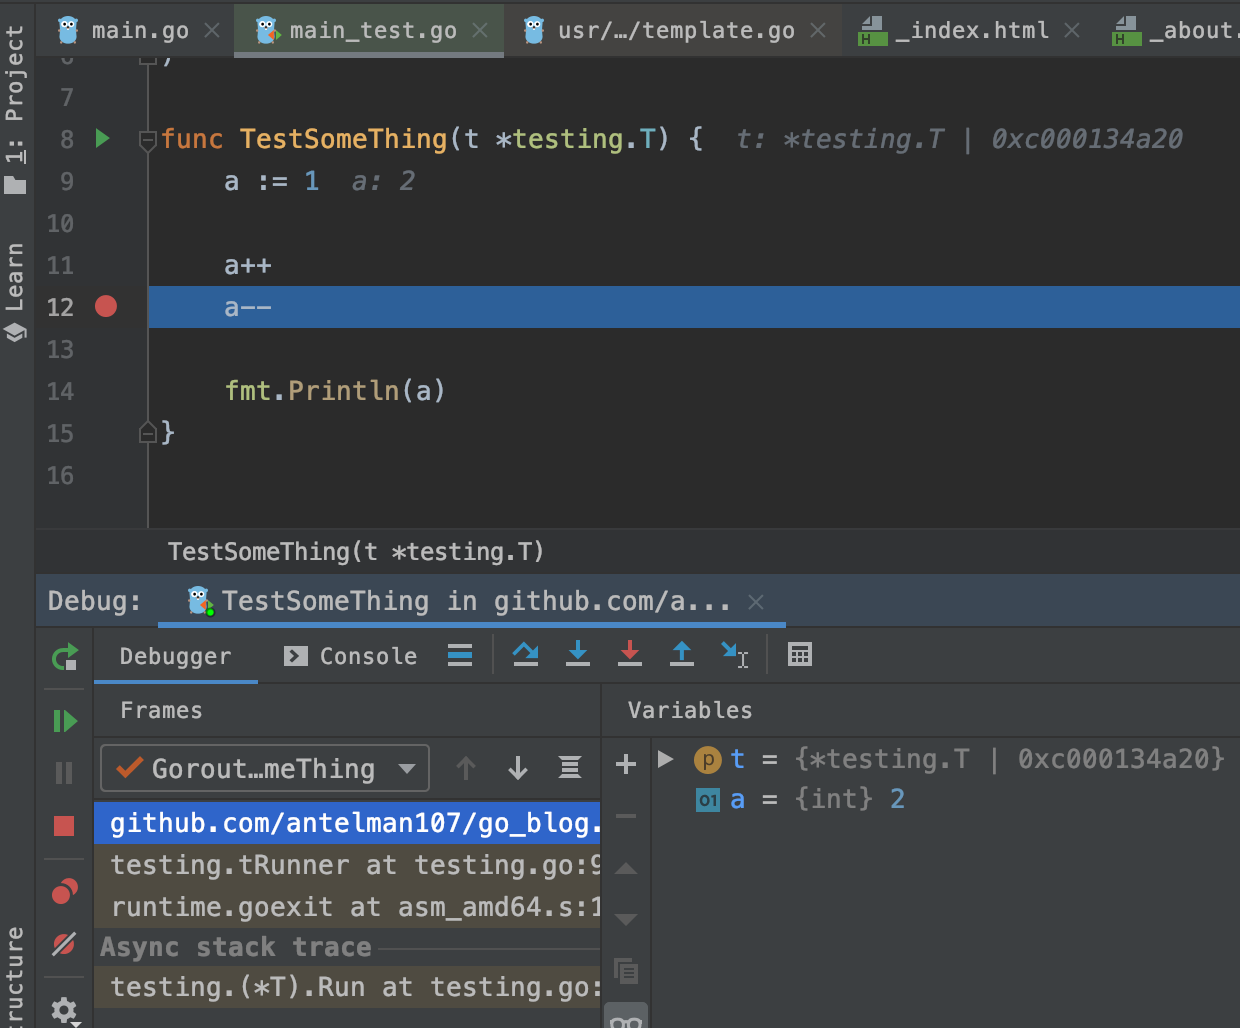
On the left side of the debug toolbar, you can see the stack trace (all functions called before the breakpoint is reached). This trace is very informative if you explore a new repo and want to understand if particular code executes and what other instructions are involved. Yes, there are function usage tools in GoLand. You can see all usage cases of any function, but it can take time, because you’ll need to check many function usages until you find main.go. A debugger simply shows you the full trace. On the right side, you can see any variables that are accessible in the scope of the breakpoint. On the left toolbar, there are buttons to move between breakpoints.
Why should one use a debugger?
1. No code modifications
To see what is happening in the program, you don’t need to add any debug code (fmt.Print, etc.). If you choose to add debug code, this code will be located in the same files you want to debug, so it could be in all possible files of the project. There is no way to separate what code is for debugging and what is for production. You’ll have to manually check any changes you made before committing to find and remove debug code. And even after that, there is a high probability of pushing debug code to the repo (which is a mistake you don’t want to happen).
2. Simple way to explore any kind of variable
The debugger’s variables view is also much more user-friendly than any output you can program to list variables. For example, look how simple it is to view any complex structs or lists:
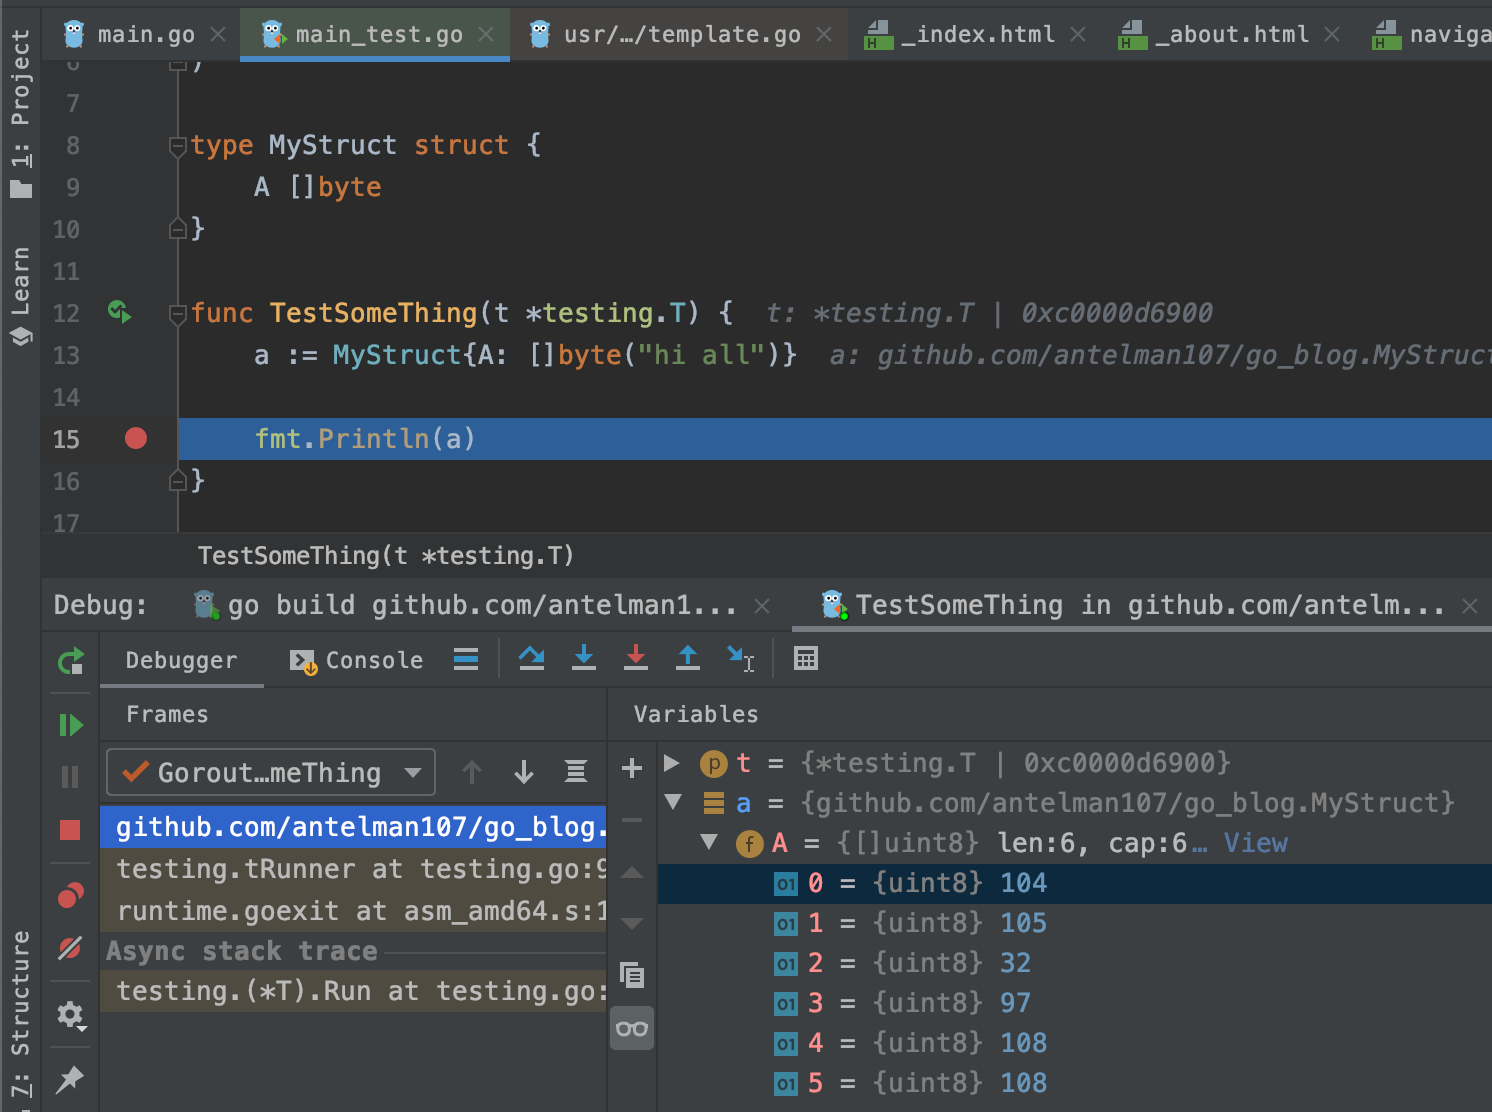
You can see a byte array created from a string, and you can also see it as text by clicking the “View” link. How much time will you spend trying to display that data? It won’t be one line of code, and that code depends on the variable type you want to explore. A debugger displays any variable gracefully.
Drawbacks
A debugger changes the behavior of the program. Go is known for its concurrency patterns, so you probably have a lot of goroutines in your program. A breakpoint is set in code that relates to one or some of all goroutines, but what happens in other goroutines is the responsibility of the debugger. In GoLand, all goroutines are stopped. But there can be situations when you want to collect debug data but don’t want the program to stop. In that case, you’ll still need to get this debug info without a debugger.
That is basically all on the current topic. Feel free to comment on this post here on the website, or join our telegram group.
Related Articles
Remote debugging with Delve
Previously we discussed local debugging with GoLand IDE. Now we’ll discuss how to remotely debug a program running inside a Docker container using Visual Studio Code and GoLand IDE.
Read More → Docker Debugger Delve Vscode Goland